Researchers dig into the history of the Large Magellanic Cloud

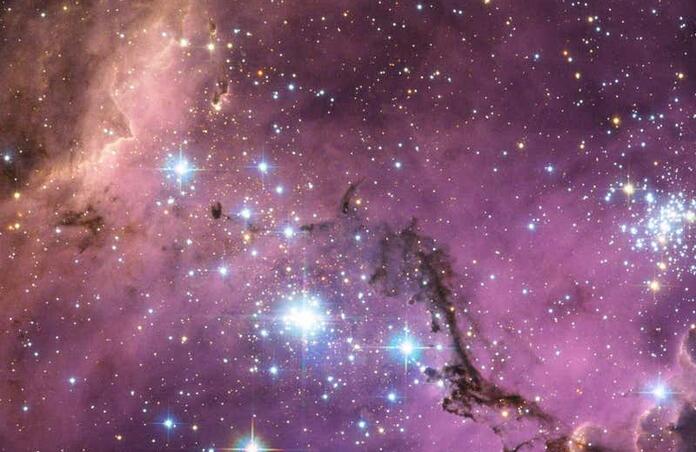
Fantastic new images show the details of the Large Magellanic Cloud and of its history – but also of its background.
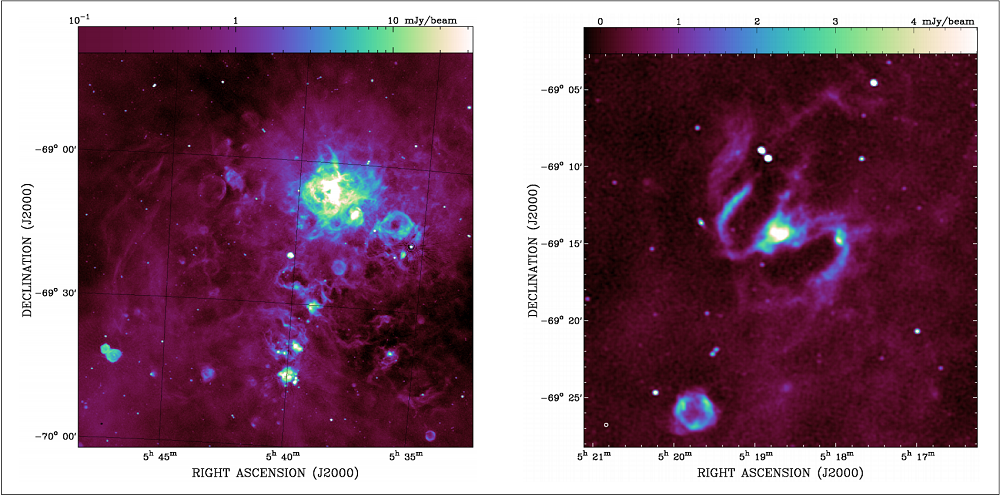
The Evolutionary Map of the Universe (EMU) Early Science Project uses the Australian Square Kilometre Array Pathfinder (ASKAP) to produce unprecedently sharp images revealing sources of radio emissions. The team’s initial goal was to observe individual stars, supernova remnants and nebula in the Large Magellanic Cloud (LMC). The LMC is a satellite of the Milky Way just like the Small Magellanic Cloud; at a distance of “only” 163 000 light-years, it will be absorbed by our galaxy in about 2.4 billion years. Its proximity does not only make it the ideal target to study galaxy formation and structure in general, but it could also give clues about the Milky Way’s formation specifically.

With ASKAP’s sensitivity though, the EMU team didn’t just record the radio emissions from 50 000 new objects within the LMC, they also discovered thousands of previously undetected background sources millions or even billions of light-years away. These get distinguished thanks to measurements of, e.g., the redshift of a spectral line, say neutral hydrogen, which typically emits at a specific wavelength, but because of the expansion of our Universe this wavelength also gets “expanded” – i.e., redshifted.

The radio data can be used to estimate the galaxy’s Faraday rotation, which is the twisting of radio waves as they travel towards us through the intergalactic medium. What’s more, by associating this data with results from previous surveys in the optical, infrared and X-ray bands, astronomers will get a very precise picture of these background galaxies.
Meanwhile, a team at the University of Padua, Italy, produced a map detailing the history of star formation in the LMC itself. Covering a substantially higher area and at higher resolutions than previous surveys, the images to produce the map were obtained with the Chilean Visible and Infrared Survey Telescope (VISTA). The data shows a peak in star formation about 0.5 to 4 billion years ago, as well as a more surprising find: in its infancy, the LMC didn’t produce as many stars as would have been expected. The researchers suggest that this could be due to systematic errors in their data analysis, since a very young star formation often implies a higher extinction rate due to the higher amount of gas and dust present when the galaxy is young and that absorbs the light from the young stars.

Moreover, the time in a galaxy’s evolution during which the most intense period of star formation occurs is likely to determine later properties of that galaxy, notably by constraining the amount of interaction that happen within it, and also by influencing the ways in which the galaxy influences neighbouring objects – in the case of the LMC, astronomers are of course particularly interested to see if and how this affects its “relationship” with our Milky Way.
Thanks to the Italian team, we have a much better view of the Milky Way’s companion, the LMC. Meanwhile, the EMU team is just getting started – the main survey is expected to start in early 2022.
Cover Image: LMC, NASA/Goddard
Image Credits:
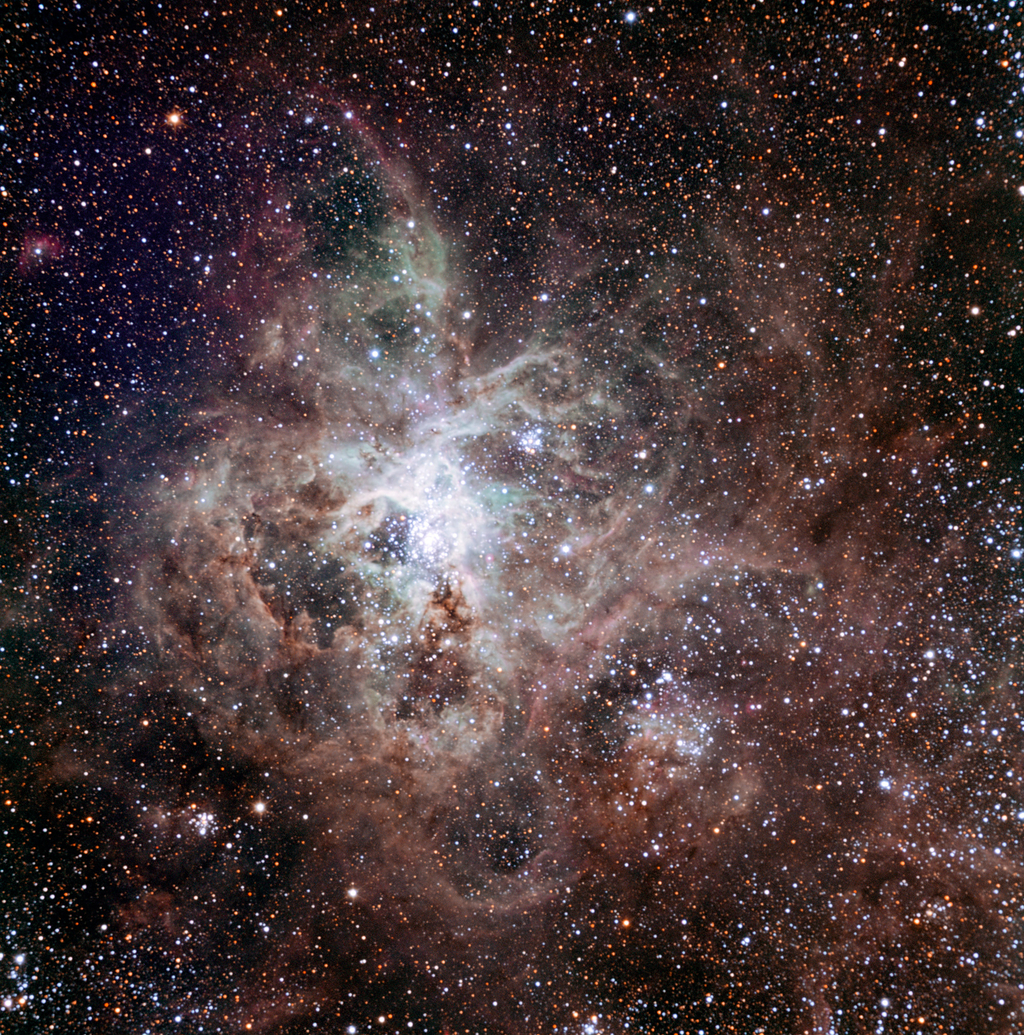
1 - Tarantula Nebula, TRAPPIST/E. Jehin/ESO
2 - ASKAP view of the LMC, Pennock et al. 2021
3 - SFR in the LMC, Mazzi et al. 2021
