Ice Layer Interference Could Mimic Liquid Water Signals Detected Beneath Martian Ice Caps

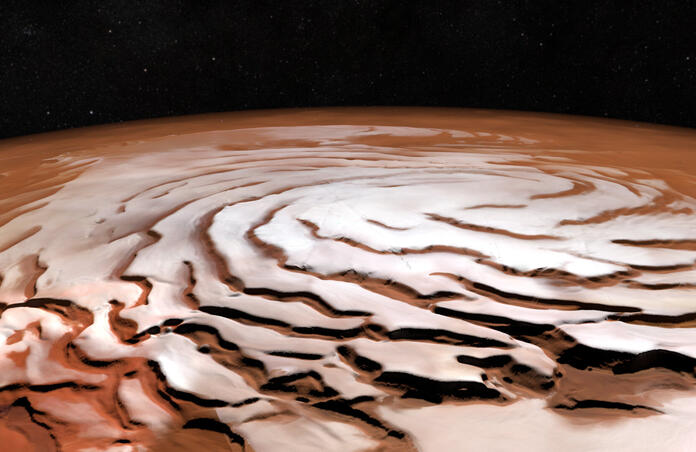
In late 2018, the European Space Agency's Mars Express orbiter gathered exciting radar data suggesting the presence of liquid water beneath Mars' south polar ice cap. The spacecraft employed radar pulses to penetrate the surface of the ice caps and investigate their composition and structure. These pulses revealed an area with exceptionally high reflectivity at a depth of around 20 km, far exceeding that of dry material or ice. This was initially interpreted as evidence of an interface between frozen and liquid water. Models supported this interpretation, proposing that a combination of higher geothermal temperatures and a lowered freezing point of water, due to the pressure and dissolved salts, could allow water to remain in a liquid state beneath the ice.
Now, a team led by Daniel Lalich challenge this interpretation of the data by providing robust simulations of how variations in the thickness and composition of subsurface ice layers can allow radar waves to constructively interfere in a manner similar to what was observed. Lalich explained that he was sceptical of preliminary conclusions as, while such a measurement would indicate liquid water on an Earth-like planet, he believed that the Mars is simply too cold.
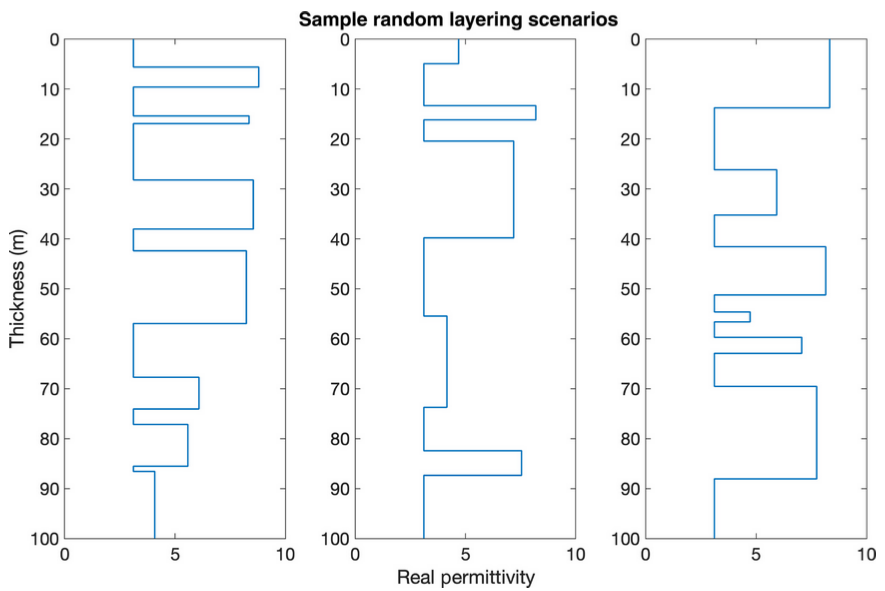
Their study explores a set of 10,000 stratigraphies, created semi-randomly using sets of constraining parameters, and explores how pulses emitted by the MARSIS radar sounder, attached to the Mars Express, would reflect off of these. These layers were generated to be thinner than the radar resolution, about 100m each, and were either composed of pure ice, or some mixture of dust and ice. Of their case study, 216 produced echoes that were consistent with MARSIS data within the bright region and of these, 99 were also consistent with observations outside of the bright region.

The key here lies within the interference of light rays reflected off of these sub-resolution layers, which if placed appropriately with just the right composition, would lead to strong constructive interference in certain regions, causing the observed spike in reflectivity.
That said, the study does highlight that within their semi-random sample, it could be expected that a few would emerge in agreement. Likewise, this is not a dominating or particularly significant proportion of sampled structures.

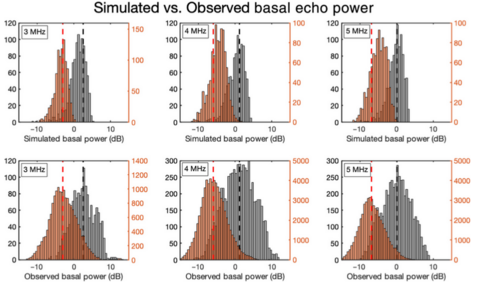
Fig 1. Histogram plots of the simulated basal power of reflected waves at certain frequencies, compared to the observed measurements. The red plots indicate behaviour outside of the bright region, while the grey plots indicate behaviour within the bright region.
In discussing his favour of this interpretation, Lalich states that their models assume a standard subsurface structure of merely water ice and dust particles, without the need to introduce any novel or anomalous material. As such, their study addresses many other explanations put forth in recent years, that attempt to circumvent the need for liquid water through other high reflectivity solids. Such a simpler approach can lead to the same, seemingly promising results, relying purely on well understood physical phenomena. However, he does stress, that just like the preliminary assessments, their further analysis is not conclusive and merely offers an alternative interpretation.
--
Journal Source: D. Lalich et al, Small variations in ice composition and layer thickness explain bright reflections below martian polar cap without liquid water, Science Advances, Vol 10, No. 23, (2024), DOI: 10.1126/sciadv.adj95
Cover Image: ESA Mars Express
