PixInsight: the image analysis tools

I’m willing to bet that if you’re using dedicated astro image processing software, you’ve at some point run across a capability of the software that does something called image analysis. If you’re like me when I first ran across this, you wondered what exactly this capability was and how to use it to your advantage. Well, like everything else in this rabbit hole of a hobby, I had to do more studying in my copy of The Handbook of Astronomical Image Processing. What follows is a short summary of chapter 7 that goes into much detail of this topic.
There is a lot of information contained in our calibrated image data that describes the image data in detail. The Image Analysis tools, at least in PixInsight which is what I use to process images, can access this information so that we can gain insight into our data and then use these insights to help get the most out of our data. As a general rule, the types of information in the calibrated data are sorted into 3 areas:
- Information about specific pixels in the data / image
- Information about the image in it’s entirety
- Information describing specifically defined regions of interest
Specific pixel information is basically the location of a pixel in the image and the specific value of that pixel. This consists of specific pixel measurements of the coordinates of that pixel in its detector array and the specific numerical value of that pixel in the calibrated image. The pixel coordinates are generally given either in Cartesian coordinate system or Computer convention coordinate system. Both use the (x, y) coordinate system; the difference is that for Cartesian system, the y-axis increases in value upwards and for Computer convention the y-axis increases downward. The x-axis in both systems increases from left to right.
Information that describes the image in its entirety is basically a survey of all the pixel information combined and contained in the image. To do this, you look at the statistical properties of the image as a whole. These statistical properties are:
- Minimum / Maximum / Mean / Median Pixel Values
- Standard Deviation of Pixel Values
- Low / High Pixel Values
Having this information allows you to determine how technically sound the image is and what the best brightness and methods to display the image is. The image’s histogram is basically an inventory of all the pixel values in an image and displays where those numerical values fall in a graphical display. The display is a logarithmic plot of number of pixels versus their value.
Information that describes a specific region of interest is a survey of all the pixels of a specific region within the image, such as the pixels that describe a single star, a part of a galaxy or a piece of a nebula within the region. Basically, this is a specifically defined area you’ve defined in the image to get statistical information for all the pixels within that defined region. Again, when you have this information, you can use it determine what the best brightnesses and methods to display the specific region in the image is and how that helps the entirety of the image.
You’ll want to investigate how to use these tools contained in your specific image processing software to your advantage. For me, I’m going to need to do more homework on PixInsight’s Image Analysis tools.
Stay safe, have a lot of fun and get your neighbors to turn off their lights at night and convince them to join in the fun….

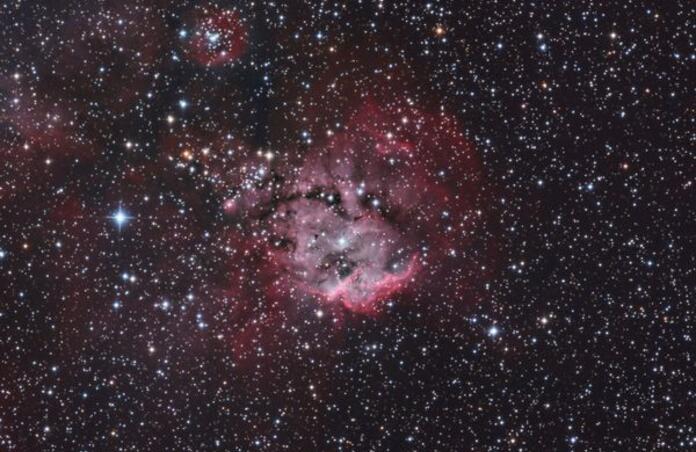
Processed in PixInsight

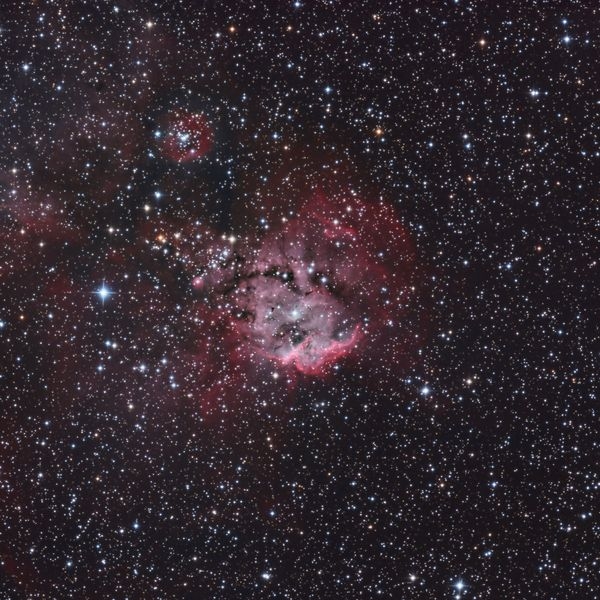
Processed in PixInsight
This blog post was originally published in our Telescope Live Community.
The Community represents Telescope Live's virtual living room, where people exchange ideas and questions around astrophotography and astronomy.
Join the conversation now to find out more about astrophotography and to improve your observation and post-processing skills!
